Data Farm


Written by: David Carneal – Digital Efficiency Consulting Group – DECG
Read Time: 3 min
Most data roadmaps fail because they’re written like heroic fantasy. “We will unify all data across the enterprise.” Cool. And I will also become a professional astronaut chef.
A practical roadmap focuses on small improvements, clear phases, and visible wins.
The best roadmap is the one you can point to in 60 days and say, “That thing? It’s real and people are using it.”
A practical 5-phase roadmap
This roadmap is designed to be executed by real humans with real deadlines. You can scale it up, but don’t skip the order.
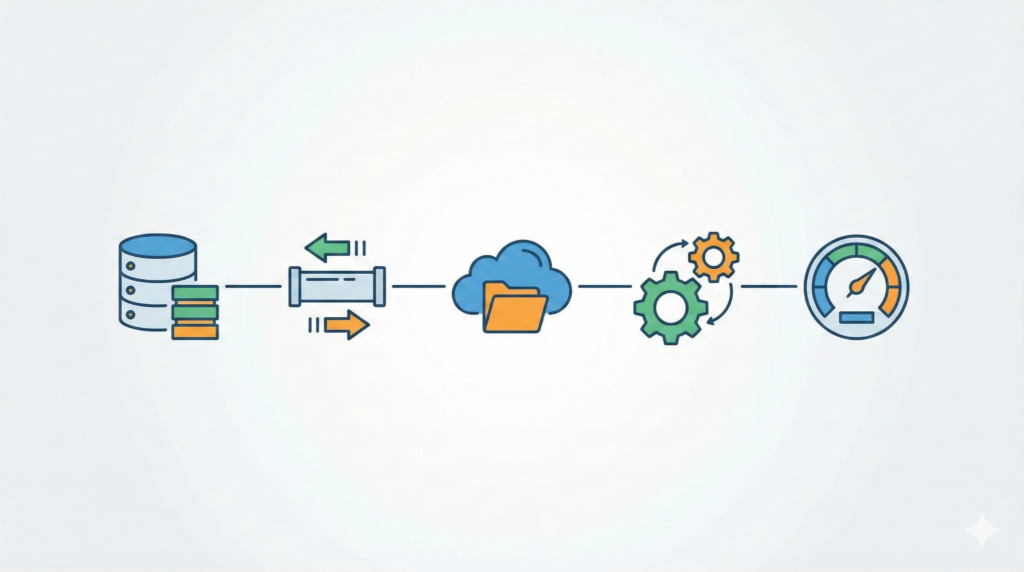
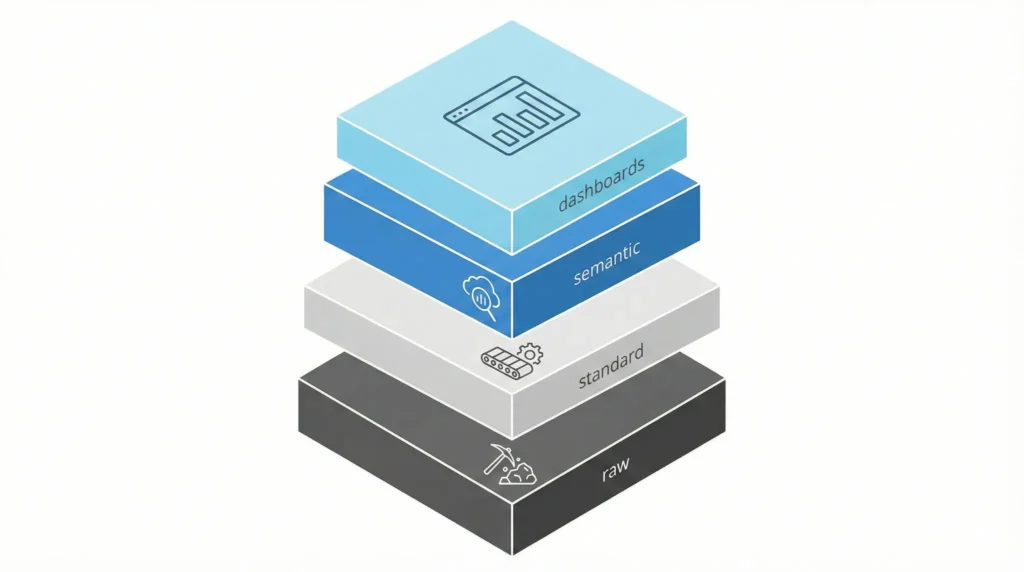
Definitions come first because everything else depends on what the business means by the metric. Raw comes next because you need receipts. Then standardization, then meaning, then dashboards.
- Definitions first: agree on 5–10 executive KPIs and document them.
- Raw + ingestion: automate landing data for 1–2 systems.
- Standardize: build universal formats for the entities involved.
- Semantic + certification: publish certified datasets and KPI logic.
- Dashboards + habits: point exec dashboards to certified outputs and keep monitoring.
Failure modes (and the fix for each)
Here are the usual ways this goes off the rails, plus the small fix that pulls it back.
These are not theoretical. If you’ve ever heard “we used to trust the dashboard, but…” you’ve met at least one of these failure modes.
- KPI logic lives in someone’s head: Fix: write definitions, assign owners, version the logic.
- Raw zone is editable: Fix: lock it down, preserve history, log ingestion.
- No monitoring: Fix: add volume checks, reconciliation checks, anomaly alerts.
- Dashboards hit source systems: Fix: insert a certified semantic layer between sources and dashboards.
- Everything is “Phase 1” forever: Fix: time-box phases and ship a narrow win.
A simple 90-day starter plan
If you want momentum, aim for one KPI and one certified dataset that leadership agrees to use. Ninety days is enough time to prove the pattern without boiling the ocean.
Start where money meets truth: order-to-cash, inventory accuracy, service response time, invoice cycle time. Pick something that matters and gets attention.
- 90-day plan (starter):
- Weeks 1–2: KPI definitions and owners (pick the top argument KPI).
- Weeks 3–6: automate ingestion for the systems that feed that KPI.
- Weeks 7–10: standardize identifiers and statuses; build semantic dataset.
- Weeks 11–12: publish dashboards from the certified dataset; label custom work.
- Ongoing: monitor, alert, and review changes.
How to know you’re winning
Your success metric isn’t “we built a platform.” It’s behavioral: fewer reconciliation meetings, fewer one-off exports, and faster decisions.
If people stop saying “I don’t trust that” and start saying “So what do we do?” you’re on the right track.
- Winning signals:
- Executive dashboards pull from certified datasets only.
- KPI definitions are stable and owned.
- Data issues show up via alerts, not surprise meetings.
- Self-service exists, but custom work is labeled and promotable.
CTA: Pick one KPI, one dataset, and one dashboard to certify in the next 90 days. If you can’t point to a certified source of truth by then, your roadmap is too heroic.
Leave a Reply