Data Farm


Written by: David Carneal – Digital Efficiency Consulting Group – DECG
Read Time: 3 min
Dashboards don’t cause drama. Dashboards reveal drama that was already hiding in the plumbing.
If your BI tool connects straight to source systems, you might get speed. You also get fragility, conflicting logic, and one broken report away from a minor organizational meltdown.
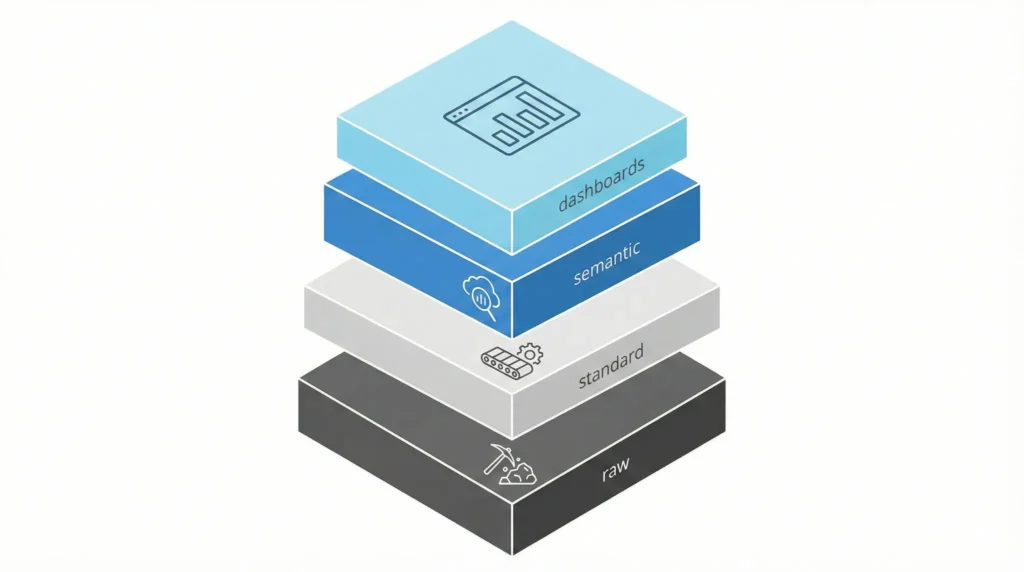
The cure is not “less data.” The cure is layers: separate receipts from standardization, meaning from presentation.
Layer 1: Raw (keep the receipts)
Raw is where data lands exactly as it arrived, timestamped and preserved. No “fixing.” No “cleaning.” No helpful hand edits.
When you preserve raw, you can audit, reconcile, and recover without guesswork. Raw is not pretty, and that’s fine. It’s not supposed to be pretty.
- Rules of raw:
- Write-protect for humans. Service accounts only.
- Keep source IDs and codes intact.
- Log ingestion and keep history.
- If something is wrong, quarantine and reprocess, don’t “patch” raw.
Layer 2: Standardized (make chaos look consistent)
This is where you normalize timezones, align customer identifiers, map statuses, and standardize codes.
It’s not glamorous. It is extremely profitable in avoided rework, because every downstream report benefits from one shared translation instead of ten private translations.
- Standardization targets:
- Dates and timezones (one rule, one clock).
- Customer, SKU, location identifiers (no duplicates, no aliases hiding).
- Status normalization (one meaning, one label).
- Mapped codes (GL, departments, reason codes).
Layer 3: Semantic (meaning with governance)
The semantic layer is what your dashboards should touch. It contains curated structures and documented KPI logic.
This is where “definition drift” goes to die, because changes require review and ownership. If someone wants to change the KPI, they can. They just can’t do it quietly.
- What belongs here:
- Conformed dimensions (Customers, Products, Dates).
- Fact tables (Orders, Shipments, Invoices).
- Certified KPI definitions with owners.
- Documentation: what’s included, excluded, and why.
Layer 4: Dashboards (serve decisions, not queries)
Dashboards should consume certified datasets. Executives should not be exposed to twelve nearly-identical versions of revenue.
Self-service analytics is still valuable, but it needs labeling: certified vs custom. Custom is not bad, it’s just not official until it’s promoted.
- Simple governance habit:
- Certified datasets feed executive dashboards.
- Custom analysis is allowed, but clearly labeled.
- If a custom metric becomes important, promote it through review.
A mini-roadmap you can actually execute
You don’t have to build all layers for all systems at once. Start where money meets truth and where the arguments are loudest.
A good first target is a KPI that spans systems, like order-to-cash: order (ERP) → pick/pack/ship (WMS) → invoice (finance). Layers turn that chain into one story.
- Pick 5–10 executive KPIs and define them.
- Automate ingestion for 1–2 critical systems.
- Build standardized mappings for the entities involved.
- Create a certified semantic dataset for those KPIs.
- Point dashboards at the certified dataset and label the rest.
CTA: Choose one dashboard that causes confusion and trace it back to the layer it should be using. If it’s connected to raw sources, your next small improvement is obvious.
Leave a Reply